

The Gold Report

Hello,
Welcome to another issue of The Gold Report.
In the news…
Inflation Is Eating Up Your Paycheck: Real Incomes Fall for Fourth Straight Month
Metals and Miners Bide their Time
Bank of Mexico Announces Its Own Central Bank Digital Currency by 2024
Could Gold Help Us Find Space Aliens?

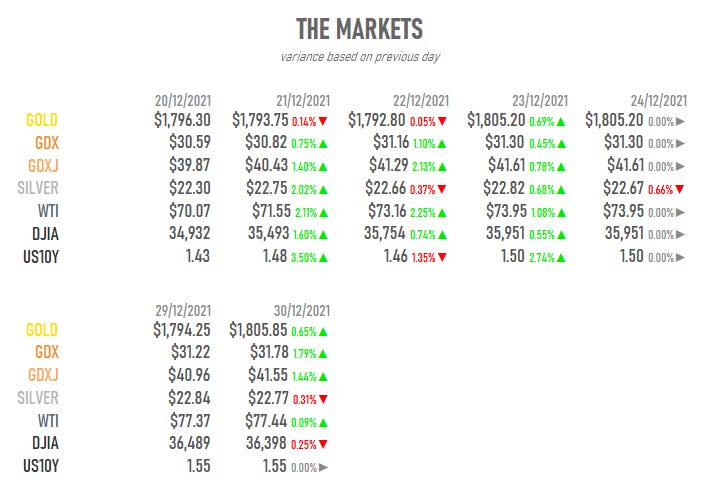
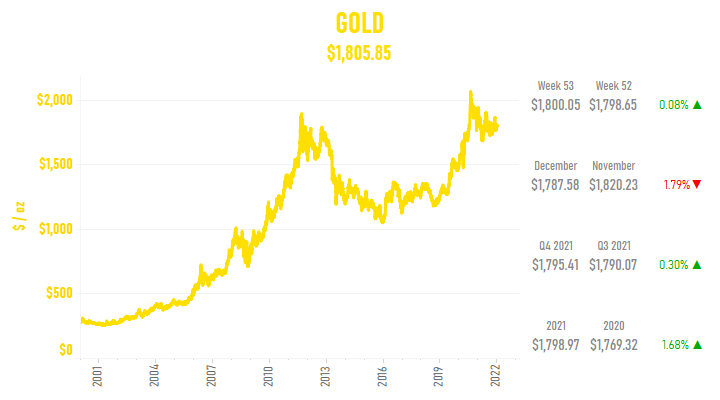
At the time of writing gold is currently at $1,824.00, with the most recent LBMA Gold Price at $1805.85 - hopefully a good sign for 2022?
The GDX and the GDXJ are both ending above $30.00 and $40.00 respectively, and the Dow Jones Industrial Average is hovering around it’s last high of ~36,400, from November - more good news for gold?
All this action despite the US10YR increasing from 1.43% to 1.55%, in the past two weeks, having started 2021 at around the 1.00% level.
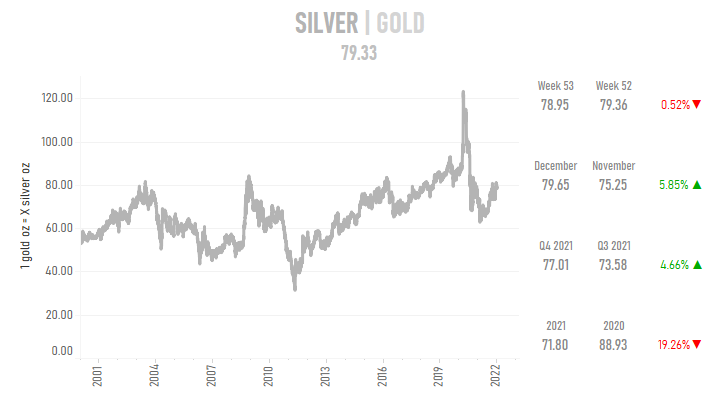
The silver-gold ratio is at ~80 silver oz per gold oz - historically a good time to load-up on silver!
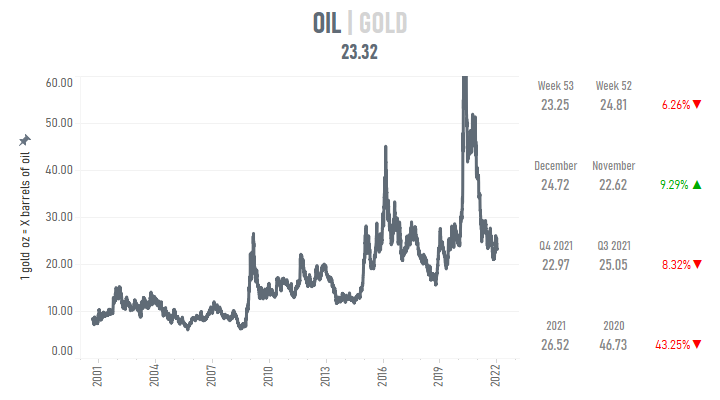
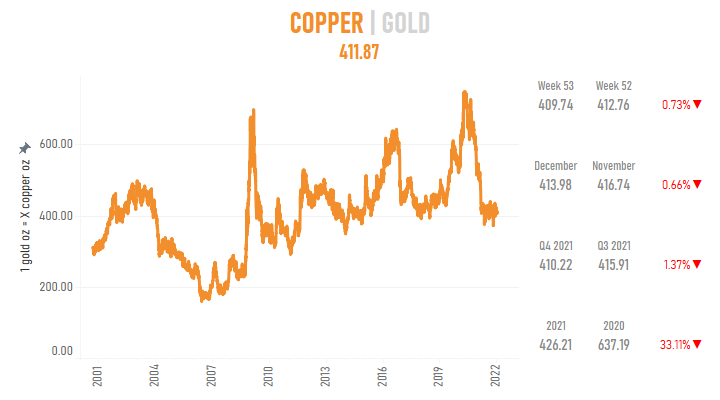

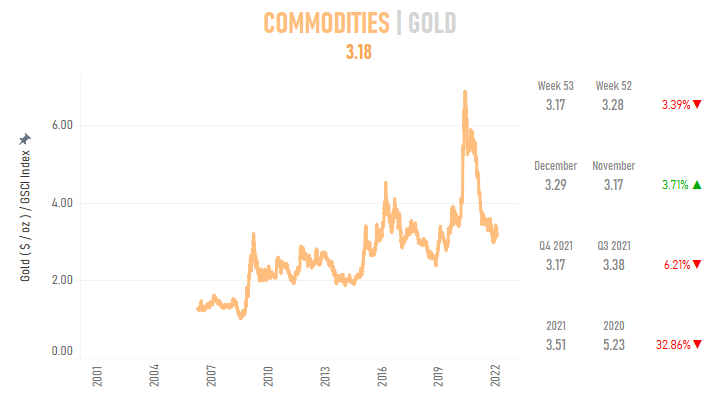
Gold not doing well against other commodities. However, this is likely due to long-standing global supply chain issues applying upward pressure on commodity prices, leaving gold with plenty of room to catch-up!

Looking for the Dow-gold ratio to edge below 20 and steamroll it’s way down to the historic 2:1 or even 1:1 ratio - the point of maximum despair in the markets!
The DJIA is now at 36,400, and gold at $1,820, so even a 2:1 ratio, after a 50% Dow-crash, could mean the DJIA at 18,200 and gold at… $9,100!

The XLU ETF is another method of comparing gold to the bond market (already heavily manipulated by the Fed), or rather to the markets perception of inflation.
The utilities sector is the most “bond-like” sector, and hence, is vulnerable to supply chain issues and input-cost increases.
The chart does not look great for gold, however, at 25 XLU shares per gold oz, it is resting on long-term support from 2001!
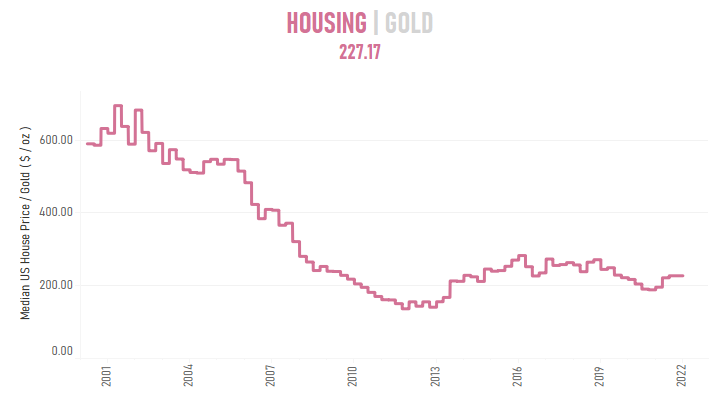
Even with the (latest) U.S. housing boom, your average U.S. home is going for not much more than 200 gold oz… keep stacking gold and you may be able to pick-up a house for less than 100 gold oz if (or when) there’s another housing crash from here!
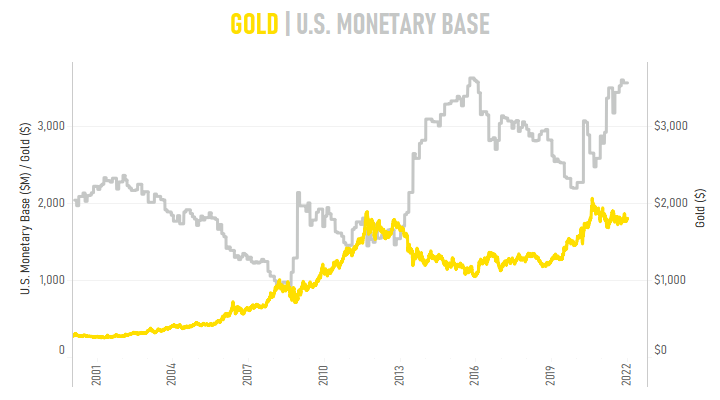
The chart above shows a great divergence/convergence pattern, indicating that with all this extra money (sorry, currency) printing, there could be a huge move in gold in 2022!


Disclaimer
I (Le Libérateur) DO NOT hold any licences, registrations, or certifications.
This article is purely for entertainment purposes ONLY, and for me to show-off my Python and Tableau skills, in the hope that someone will be stupid enough to hire me!
Any investments you choose to make based on this article are at your own risk.
If you do make any investment decisions based on this article, then you MAY need to seek professional help!
Photo by Jingming Pan on Unsplash
If you like Serfdom Road, please subscribe and share!